In the previous blog post, we have looked into the multi-host networking capabilities with Docker with native network and Calico. In this blog post, our journey to make Galera Cluster run smoothly on Docker containers continues. Deploying Galera Cluster on Docker is tricky when using orchestration tools. Due to the nature of the scheduler in container orchestration tools and the assumption of homogenous images, the scheduler will just fire the respective containers according to the run command and leave the bootstrapping process to the container’s entrypoint logic when starting up. And you do not want to do that for Galera - starting all nodes at once means each node will form a “1-node cluster” and you’ll end up with a disjointed system.
“Homogeneousing” Galera Cluster
That might be a new word, but it holds true for stateful services like MySQL Replication and Galera Cluster. As one might know, the bootstrapping process for Galera Cluster usually requires manual intervention, where you usually have to decide which node is the most advanced node to start bootstrapping from. There is nothing wrong with this step, you need to be aware of the state of each database node before deciding on the sequence of how to start them up. Galera Cluster is a distributed system, and its redundancy model works like that.
However, container orchestration tools like Docker Engine Swarm Mode and Kubernetes are not aware of the redundancy model of Galera. The orchestration tool presumes containers are independent from each other. If they are dependent, then you have to have an external service that monitors the state. The best way to achieve this is to use a key/value store as a reference point for other containers when starting up.
This is where service discovery like etcd comes into the picture. The basic idea is, each node should report its state periodically to the service. This simplifies the decision process when starting up. For Galera Cluster, the node that has wsrep_local_state_comment equal to Synced shall be used as a reference node when constructing the Galera communication address (gcomm) during joining. Otherwise, the most updated node has to get bootstrapped first.
Etcd has a very nice feature called TTL, where you can expire a key after a certain amount of time. This is useful to determine the state of a node, where the key/value entry only exists if an alive node reports to it. As a result, the node won’t have to connect to each other to determine state (which is very troublesome in a dynamic environment) when forming a cluster. For example, consider the following keys:
    {"createdIndex": 10074,"expiration": "2016-11-29T10:55:35.218496083Z","key": "/galera/my_wsrep_cluster/10.255.0.7/wsrep_last_committed","modifiedIndex": 10074,"ttl": 10,"value": "2881"
    },
    {"createdIndex": 10072,"expiration": "2016-11-29T10:55:34.650574629Z","key": "/galera/my_wsrep_cluster/10.255.0.7/wsrep_local_state_comment","modifiedIndex": 10072,"ttl": 10,"value": "Synced"
    }
After 10 seconds (ttl value), those keys will be removed from the entry. Basically, all nodes should report to etcd periodically with an expiring key. Container should report every N seconds when it's alive (wsrep_cluster_state_comment=Synced and wsrep_last_committed=#value) via a background process. If a container is down, it will no longer send the update to etcd, thus the keys are removed after expiration. This simply indicates that the node was registered but is no longer synced with the cluster. It will be skipped when constructing the Galera communication address at a later point.
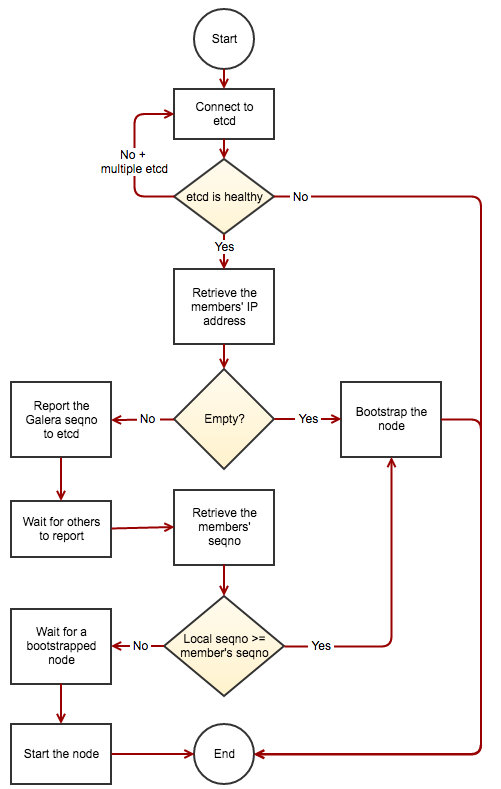
The overall flow of joining procedure is illustrated in the following flow chart:
We have built a Docker image that follows the above. It is specifically built for running Galera Cluster using Docker’s orchestration tool. It is available at Docker Hub and our Github repository. It requires an etcd cluster as the discovery service (supports multiple etcd hosts) and based on Percona XtraDB Cluster 5.6. The image includes Percona Xtrabackup, jq (JSON processor) and also a shell script tailored for Galera health check called report_status.sh.
You are welcome to fork or contribute to the project. Any bugs can be reported via Github or via our support page.
Deploying etcd Cluster
etcd is a distributed key value store that provides a simple and efficient way to store data across a cluster of machines. It’s open-source and available on GitHub. It provides shared configuration and service discovery. A simple use-case is to store database connection details or feature flags in etcd as key value pairs. It gracefully handles leader elections during network partitions and will tolerate machine failures, including the leader.
Since etcd is the brain of the setup, we are going to deploy it as a cluster daemon, on three nodes, instead of using containers. In this example, we are going to install etcd on each of the Docker hosts and form a three-node etcd cluster for better availability.
We used CentOS 7 as the operating system, with Docker v1.12.3, build 6b644ec. The deployment steps in this blog post are basically similar to the one used in our previous blog post.
Install etcd packages:
$ yum install etcd
Modify the configuration file accordingly depending on the Docker hosts:
$ vim /etc/etcd/etcd.conf
For docker1 with IP address 192.168.55.111:
ETCD_NAME=etcd1
ETCD_DATA_DIR="/var/lib/etcd/default.etcd"
ETCD_LISTEN_PEER_URLS="http://0.0.0.0:2380"
ETCD_LISTEN_CLIENT_URLS="http://0.0.0.0:2379"
ETCD_INITIAL_ADVERTISE_PEER_URLS="http://192.168.55.111:2380"
ETCD_INITIAL_CLUSTER="etcd1=http://192.168.55.111:2380,etcd2=http://192.168.55.112:2380,etcd3=http://192.168.55.113:2380"
ETCD_INITIAL_CLUSTER_STATE="new"
ETCD_INITIAL_CLUSTER_TOKEN="etcd-cluster-1"
ETCD_ADVERTISE_CLIENT_URLS="http://0.0.0.0:2379"
For docker2 with IP address 192.168.55.112:
ETCD_NAME=etcd2
ETCD_DATA_DIR="/var/lib/etcd/default.etcd"
ETCD_LISTEN_PEER_URLS="http://0.0.0.0:2380"
ETCD_LISTEN_CLIENT_URLS="http://0.0.0.0:2379"
ETCD_INITIAL_ADVERTISE_PEER_URLS="http://192.168.55.112:2380"
ETCD_INITIAL_CLUSTER="etcd1=http://192.168.55.111:2380,etcd2=http://192.168.55.112:2380,etcd3=http://192.168.55.113:2380"
ETCD_INITIAL_CLUSTER_STATE="new"
ETCD_INITIAL_CLUSTER_TOKEN="etcd-cluster-1"
ETCD_ADVERTISE_CLIENT_URLS="http://0.0.0.0:2379"
For docker3 with IP address 192.168.55.113:
ETCD_NAME=etcd3
ETCD_DATA_DIR="/var/lib/etcd/default.etcd"
ETCD_LISTEN_PEER_URLS="http://0.0.0.0:2380"
ETCD_LISTEN_CLIENT_URLS="http://0.0.0.0:2379"
ETCD_INITIAL_ADVERTISE_PEER_URLS="http://192.168.55.113:2380"
ETCD_INITIAL_CLUSTER="etcd1=http://192.168.55.111:2380,etcd2=http://192.168.55.112:2380,etcd3=http://192.168.55.113:2380"
ETCD_INITIAL_CLUSTER_STATE="new"
ETCD_INITIAL_CLUSTER_TOKEN="etcd-cluster-1"
ETCD_ADVERTISE_CLIENT_URLS="http://0.0.0.0:2379"
Start the service on docker1, followed by docker2 and docker3:
$ systemctl enable etcd
$ systemctl start etcd
Verify our cluster status using etcdctl:
[docker3 ]$ etcdctl cluster-health
member 2f8ec0a21c11c189 is healthy: got healthy result from http://0.0.0.0:2379
member 589a7883a7ee56ec is healthy: got healthy result from http://0.0.0.0:2379
member fcacfa3f23575abe is healthy: got healthy result from http://0.0.0.0:2379
cluster is healthy
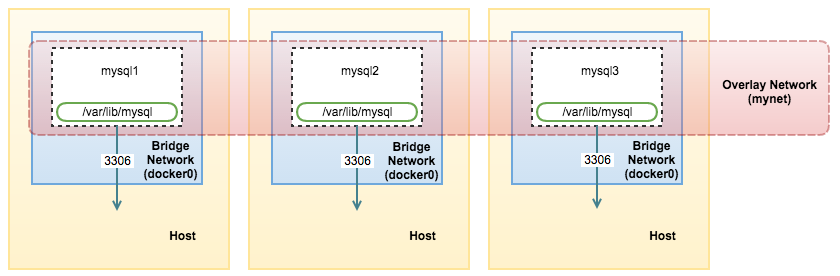
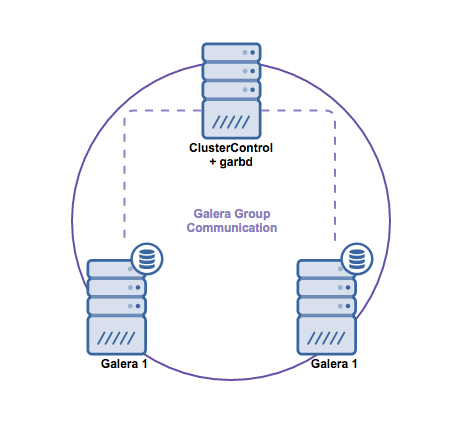
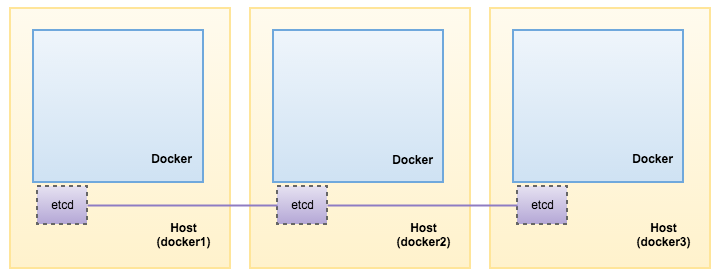
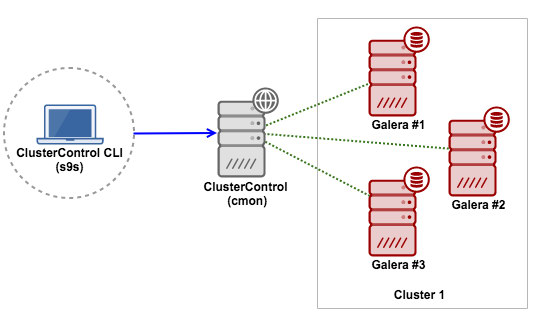
That’s it. Our etcd is now running as a cluster on three nodes. The below illustrates our architecture:
Deploying Galera Cluster
Minimum of 3 containers is recommended for high availability setup. Thus, we are going to create 3 replicas to start with, it can be scaled up and down afterwards. Running standalone is also possible with standard "docker run" command as shown further down.
Before we start, it’s a good idea to remove any sort of keys related to our cluster name in etcd:
$ etcdctl rm /galera/my_wsrep_cluster --recursive
Ephemeral Storage
This is a recommended way if you plan on scaling the cluster out on more nodes (or scale back by removing nodes). To create a three-node Galera Cluster with ephemeral storage (MySQL datadir will be lost if the container is removed), you can use the following command:
$ docker service create \
--name mysql-galera \
--replicas 3 \
-p 3306:3306 \
--network galera-net \
--env MYSQL_ROOT_PASSWORD=mypassword \
--env DISCOVERY_SERVICE=192.168.55.111:2379,192.168.55.112:2379,192.168.55.113:2379 \
--env XTRABACKUP_PASSWORD=mypassword \
--env CLUSTER_NAME=my_wsrep_cluster \
severalnines/pxc56
Persistent Storage
To create a three-node Galera Cluster with persistent storage (MySQL datadir persists if the container is removed), add the mount option with type=volume:
$ docker service create \
--name mysql-galera \
--replicas 3 \
-p 3306:3306 \
--network galera-net \
--mount type=volume,source=galera-vol,destination=/var/lib/mysql \
--env MYSQL_ROOT_PASSWORD=mypassword \
--env DISCOVERY_SERVICE=192.168.55.111:2379,192.168.55.112:2379,192.168.55.113:2379 \
--env XTRABACKUP_PASSWORD=mypassword \
--env CLUSTER_NAME=my_wsrep_cluster \
severalnines/pxc56
Custom my.cnf
If you would like to include a customized MySQL configuration file, create a directory on the physical host beforehand:
$ mkdir /mnt/docker/mysql-config # repeat on all Docker hosts
Then, use the mount option with “type=bind” to map the path into the container. In the following example, the custom my.cnf is located at /mnt/docker/mysql-config/my-custom.cnf on each Docker host:
$ docker service create \
--name mysql-galera \
--replicas 3 \
-p 3306:3306 \
--network galera-net \
--mount type=volume,source=galera-vol,destination=/var/lib/mysql \
--mount type=bind,src=/mnt/docker/mysql-config,dst=/etc/my.cnf.d \
--env MYSQL_ROOT_PASSWORD=mypassword \
--env DISCOVERY_SERVICE=192.168.55.111:2379,192.168.55.112:2379,192.168.55.113:2379 \
--env XTRABACKUP_PASSWORD=mypassword \
--env CLUSTER_NAME=my_wsrep_cluster \
severalnines/pxc56
Wait for a couple of minutes and verify the service is running (CURRENT STATE = Running):
$ docker service ls mysql-galera
ID                         NAME            IMAGE               NODE           DESIRED STATE  CURRENT STATE           ERROR
2vw40cavru9w4crr4d2fg83j4  mysql-galera.1  severalnines/pxc56  docker1.local  Running        Running 5 minutes ago
1cw6jeyb966326xu68lsjqoe1  mysql-galera.2  severalnines/pxc56  docker3.local  Running        Running 12 seconds ago
753x1edjlspqxmte96f7pzxs1  mysql-galera.3  severalnines/pxc56  docker2.local  Running        Running 5 seconds ago
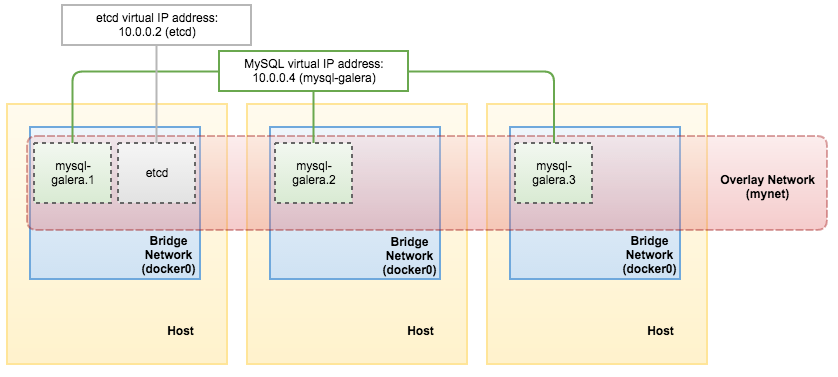
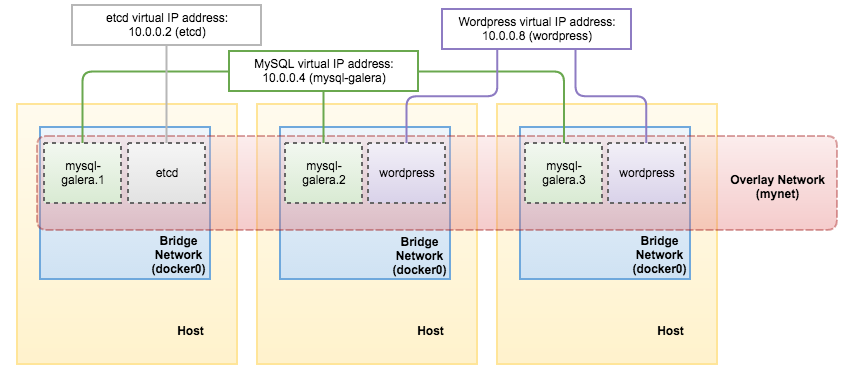
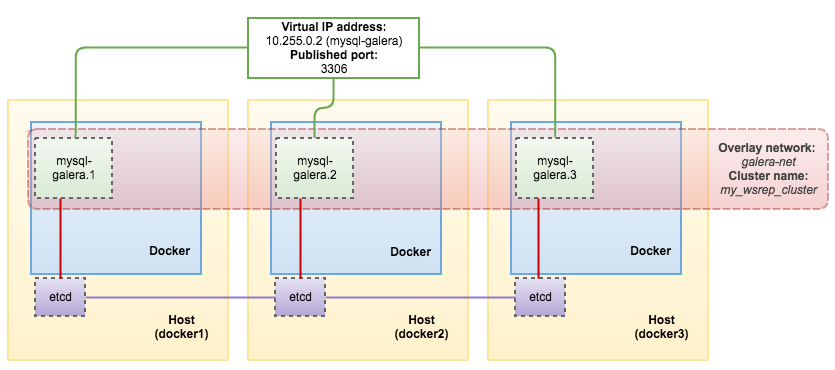
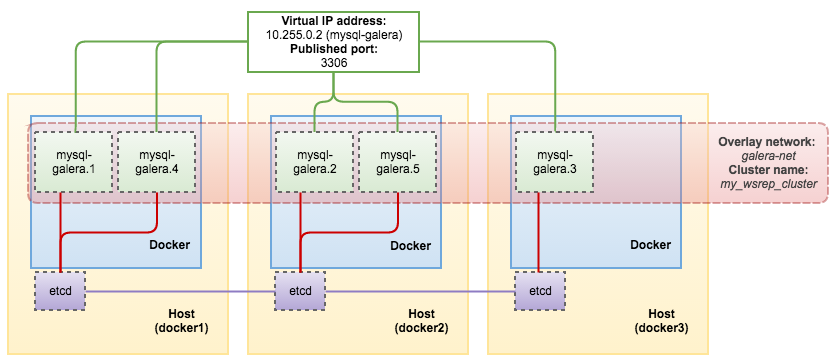
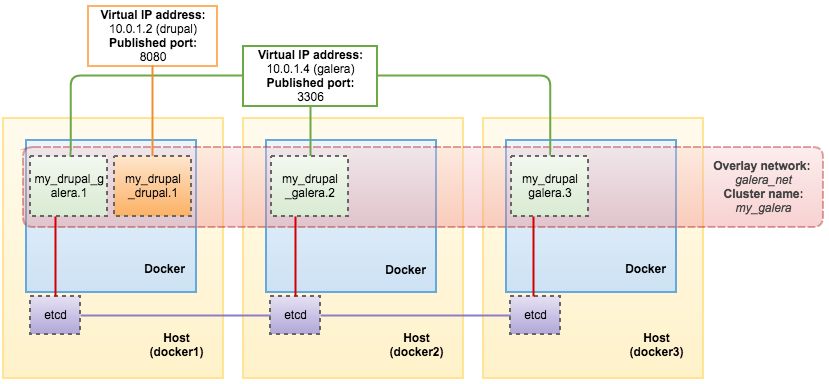
External applications/clients can connect to any Docker host IP address or hostname on port 3306, requests will be load balanced between the Galera containers. The connection gets NATed to a Virtual IP address for each service "task" (container, in this case) using the Linux kernel's built-in load balancing functionality, IPVS. If the application containers reside in the same overlay network (galera-net), then use the assigned virtual IP address instead. You can retrieve it using the inspect option:
$ docker service inspect mysql-galera -f "{{ .Endpoint.VirtualIPs }}"
[{89n5idmdcswqqha7wcswbn6pw 10.255.0.2/16} {1ufbr56pyhhbkbgtgsfy9xkww 10.0.0.2/24}]
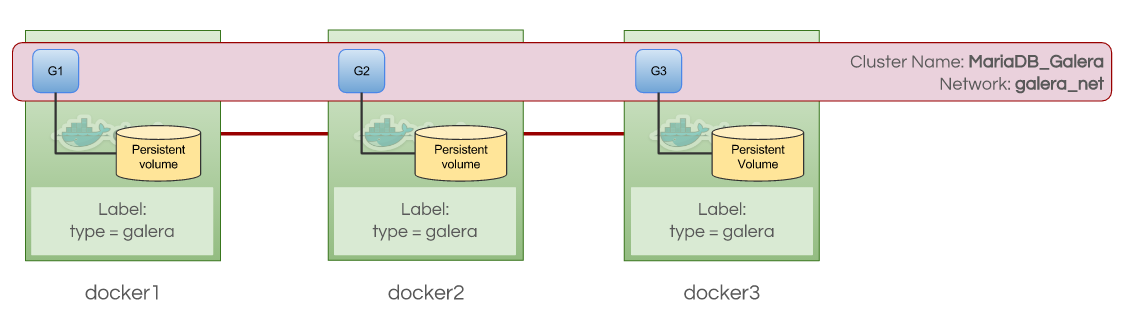
Our architecture is now looking like this:
As a side note, you can also run Galera in standalone mode. This is probably useful for testing purposes like backup and restore, testing the impact of queries and so on. To run it just like a standalone MySQL container, use the standard docker run command:
$ docker run -d \
-p 3306 \
--name=galera-single \
-e MYSQL_ROOT_PASSWORD=mypassword \
-e DISCOVERY_SERVICE=192.168.55.111:2379,192.168.55.112:2379,192.168.55.113:2379 \
-e CLUSTER_NAME=my_wsrep_cluster \
-e XTRABACKUP_PASSWORD=mypassword \
severalnines/pxc56
Single Console for Your Entire Database Infrastructure
Deploy, manage, monitor, scale your databases on the technology stack of your choice!
Scaling the Cluster
There are two ways you can do scaling:
- Use “docker service scale” command.
- Create a new service with same CLUSTER_NAME using “docker service create” command.
Docker’s “scale” Command
The scale command enables you to scale one or more services either up or down to the desired number of replicas. The command will return immediately, but the actual scaling of the service may take some time. Galera needs to be run an odd number of nodes to avoid network partitioning.
So a good number to scale to would be 5 and so on:
$ docker service scale mysql-galera=5
Wait for a couple of minutes to let the new containers reach the desired state. Then, verify the running service:
$ docker service ls
ID            NAME          REPLICAS  IMAGE               COMMAND
bwvwjg248i9u  mysql-galera  5/5       severalnines/pxc56
One drawback of using this method is that you have to use ephemeral storage because Docker will likely schedule the new containers on a Docker host that already has a Galera container running. If this happens, the volume will overlap the existing Galera containers’ volume. If you would like to use persistent storage and scale in Docker Swarm mode, you should create another new service with a couple of different options, as described in the next section.
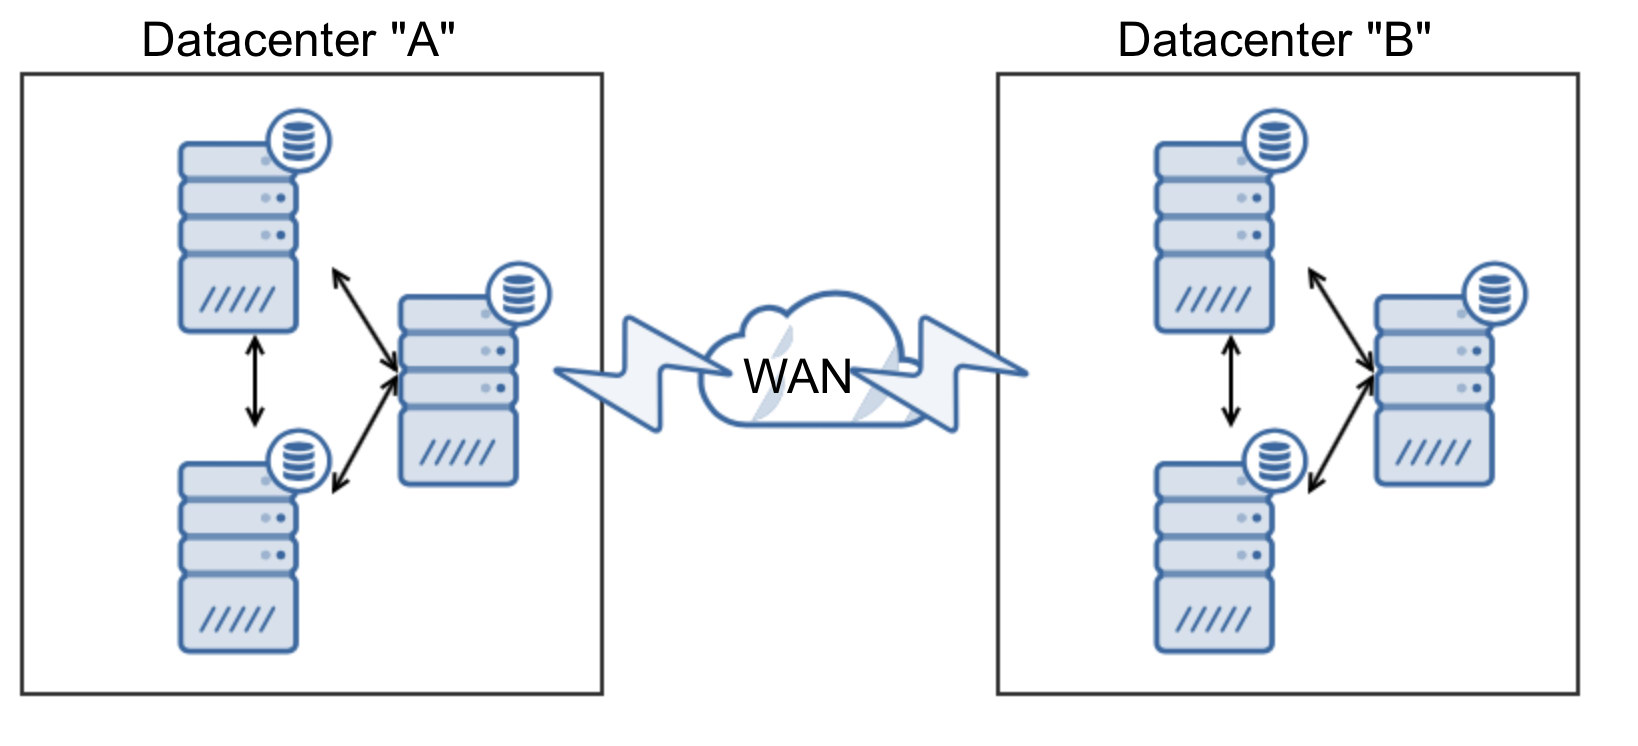
At this point, our architecture looks like this:
Another Service with Same Cluster Name
Another way to scale is to create another service with the same CLUSTER_NAME and network. However, you can’t really use the exact same command as the first one due to the following reasons:
- The service name should be unique.
- The port mapping must be other than 3306, since this port has been assigned to the mysql-galera service.
- The volume name should be different to distinguish them from the existing Galera containers.
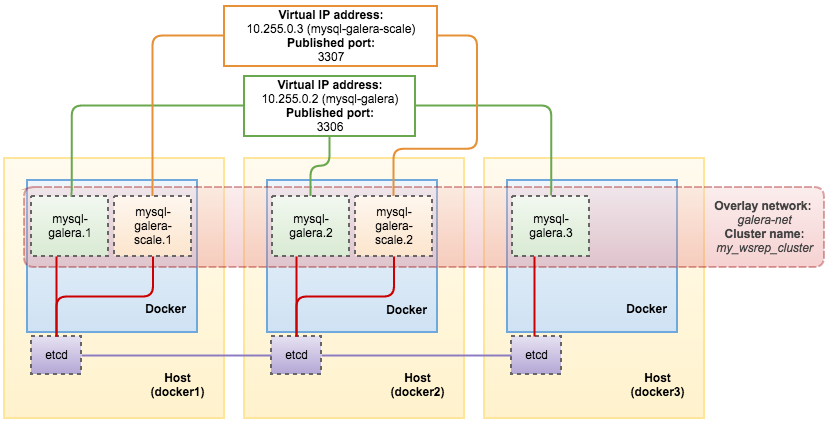
A benefit of doing this is you will got another virtual IP address assigned to the “scaled” service. This allows you to have an additional option for your application or client to connect to the “scaled” IP address for various tasks, e.g. perform a full backup in desync mode, database consistency check or server auditing.
The following example shows the command to add two more nodes to the cluster in a new service called mysql-galera-scale:
$ docker service create \
--name mysql-galera-scale \
--replicas 2 \
-p 3307:3306 \
--network galera-net \
--mount type=volume,source=galera-scale-vol,destination=/var/lib/mysql \
--env MYSQL_ROOT_PASSWORD=mypassword \
--env DISCOVERY_SERVICE=192.168.55.111:2379,192.168.55.112:2379,192.168.55.113:2379 \
--env XTRABACKUP_PASSWORD=mypassword \
--env CLUSTER_NAME=my_wsrep_cluster \
severalnines/pxc56
If we look into the service list, here is what we see:
$ docker service ls
ID            NAME                REPLICAS  IMAGE               COMMAND
0ii5bedv15dh  mysql-galera-scale  2/2       severalnines/pxc56
71pyjdhfg9js  mysql-galera        3/3       severalnines/pxc56
And when you look into the cluster size on one of the container, you should get 5:
[root@docker1 ~]# docker exec -it $(docker ps | grep mysql-galera | awk {'print $1'}) mysql -uroot -pmypassword -e 'show status like "wsrep_cluster_size"'
Warning: Using a password on the command line interface can be insecure.
+--------------------+-------+
| Variable_name      | Value |
+--------------------+-------+
| wsrep_cluster_size | 5     |
+--------------------+-------+
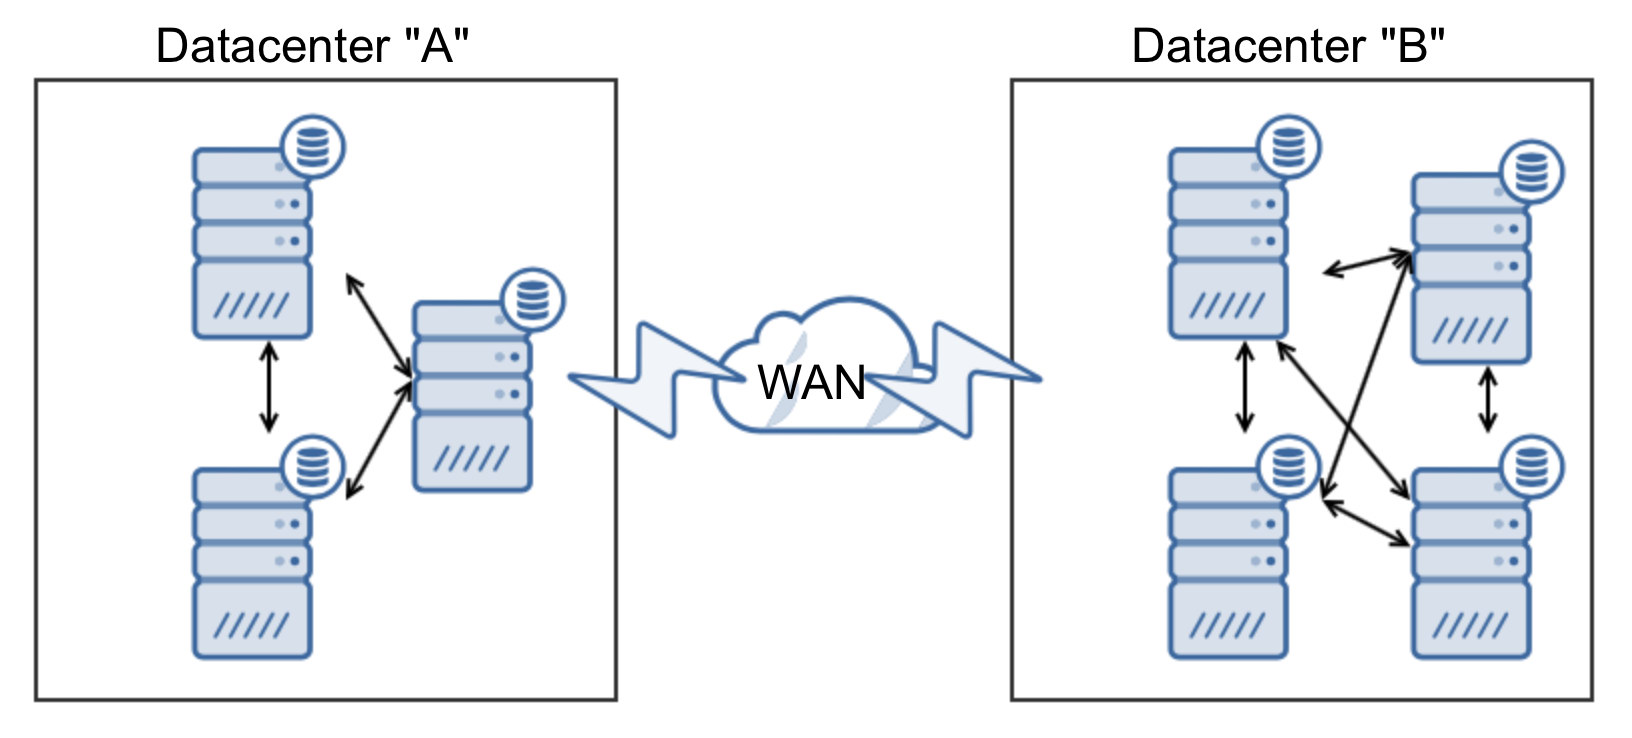
At this point, our architecture looks like this:
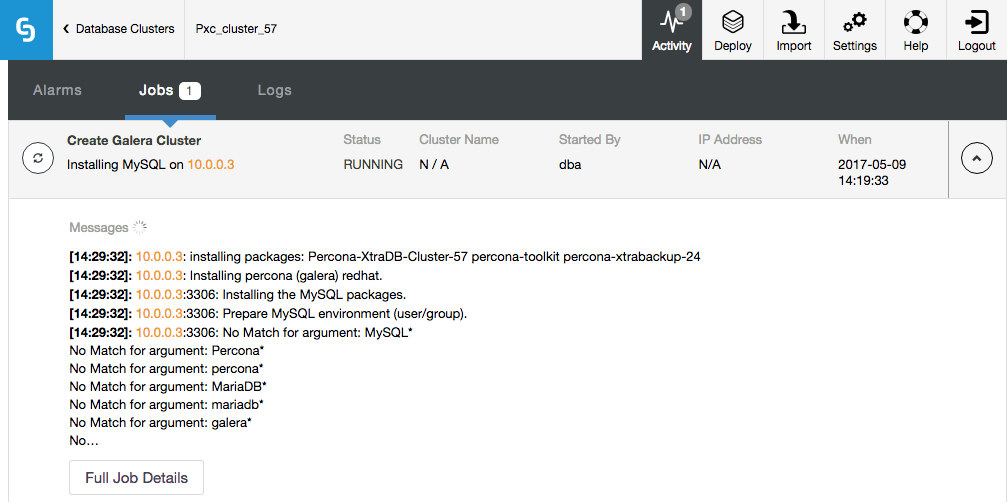
To get a clearer view of the process, we can simply look at the MySQL error log file (located under Docker’s data volume) on one of the running containers, for example:
$ tail -f /var/lib/docker/volumes/galera-vol/_data/error.log
Scale Down
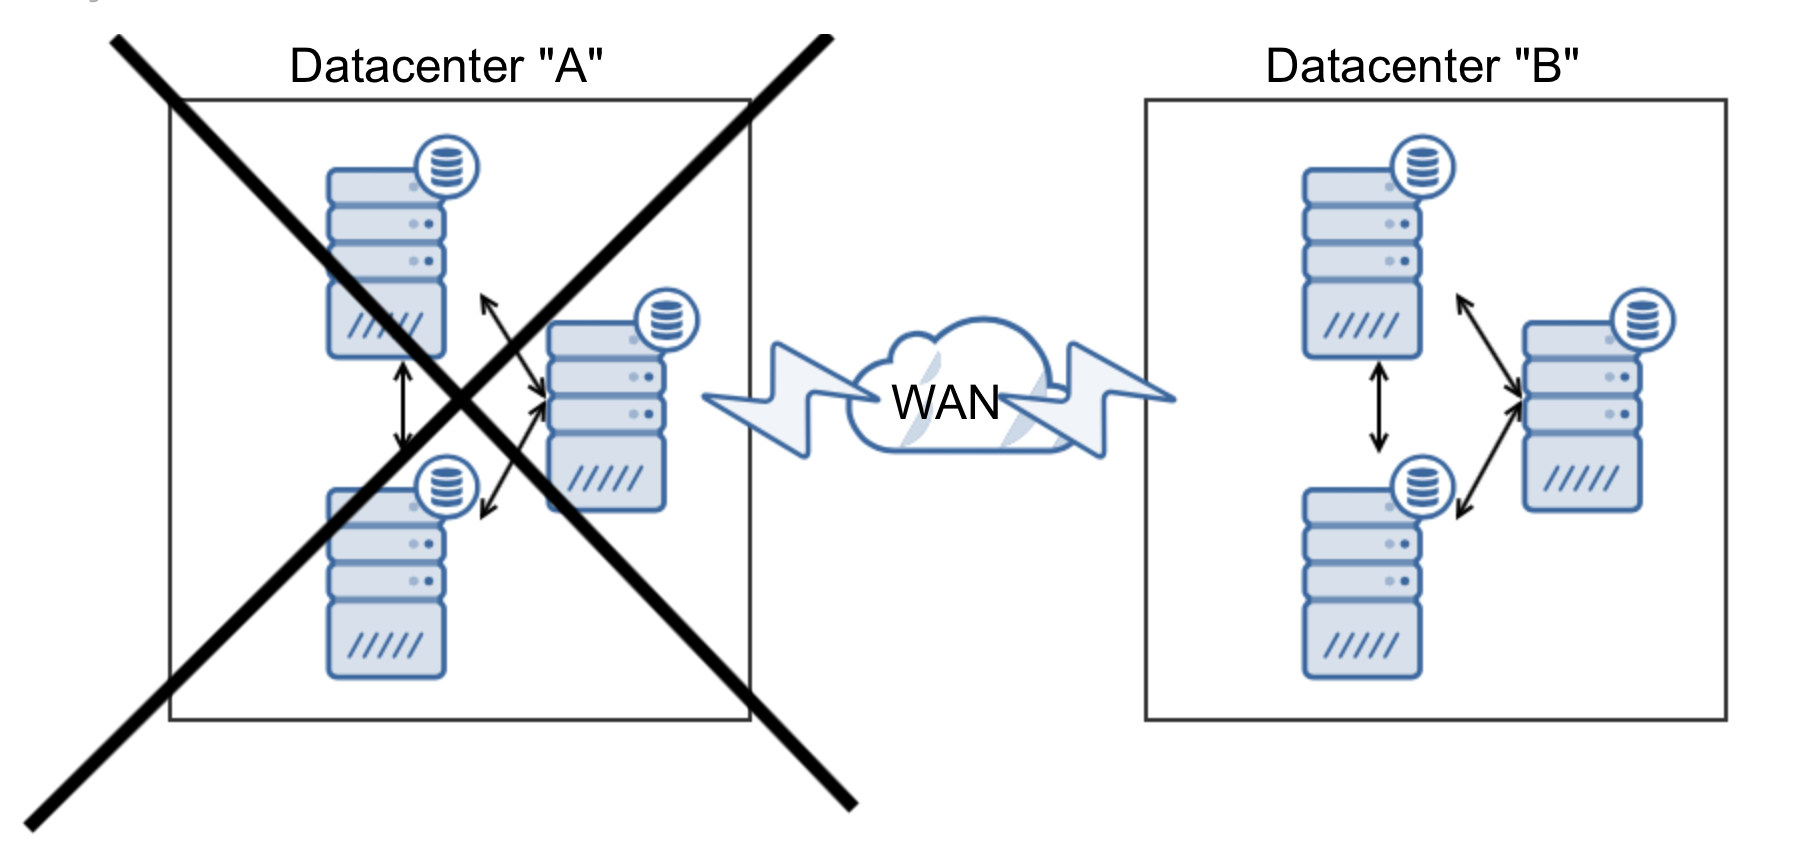
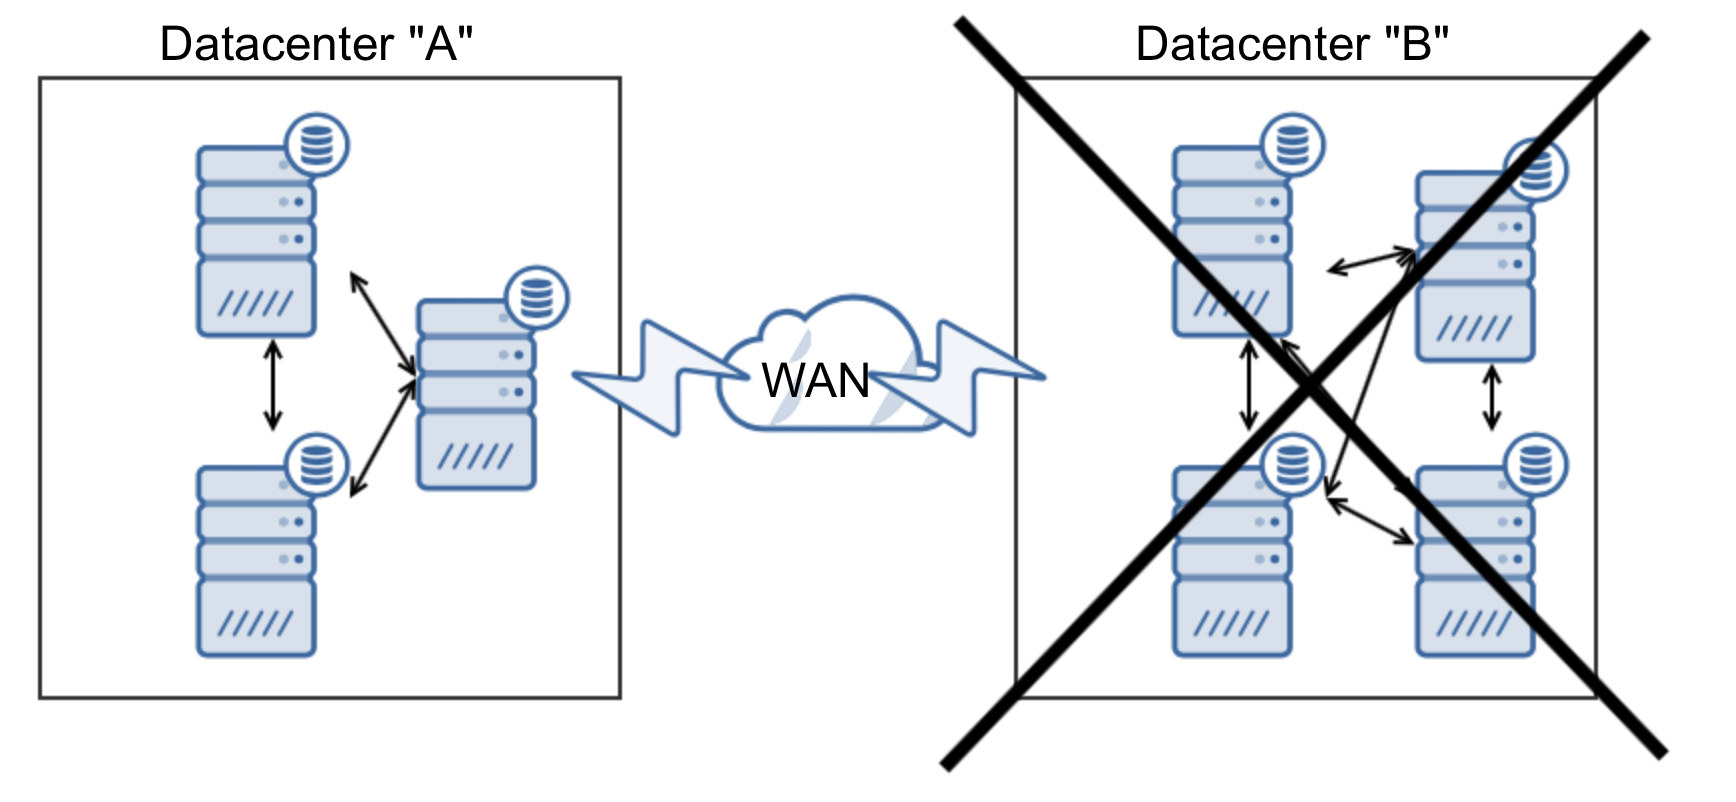
Scaling down is simple. Just reduce the number of replicas or remove the service that holds the minority number of containers to ensure that Galera is still in quorum. For example, if you have fired two groups of nodes with 3 + 2 containers and reach total of 5, the majority need to survive thus you can only remove the second group with 2 containers. If you have three groups with 3 + 2 + 2 containers, you can lose a maximum of 3 containers. This is due to the fact that the Docker Swarm scheduler simply terminates and removes the containers corresponding to the service. This makes Galera think that there are nodes failing, as they are not shut down in a graceful way.
If you scaled up using “docker service scale” command, you should scale down using the same method by reducing the number of replicas. To scale it down, simply do:
$ docker service scale mysql-galera=3
Otherwise, if you chose to create another service to scale up, then simply remove the respective service to scale down:
$ docker service rm mysql-galera-scale
Known Limitations
There will be no automatic recovery if a split-brain happens (where all nodes are in Non-Primary state). This is because the MySQL service is still running, yet it will refuse to serve any data and will return error to the client. Docker has no capability to detect this since what it cares about is the foreground MySQL process which is not terminated, killed or stopped. Automating this process is risky, especially if the service discovery is co-located with the Docker host (etcd would also lose contact with other members). Although if the service discovery is healthy somewhere else, it is probably unreachable from the Galera containers perspective, preventing each other to see the container’s status correctly during the glitch.
In this case, you will need to intervene manually.
Choose the most advanced node to bootstrap and then run the following command to promote the node as Primary (other nodes shall then rejoin automatically if the network recovers):
$ docker exec -it [container ID] mysql -uroot -pyoursecret -e 'set global wsrep_provider_option="pc.bootstrap=1"'
Also, there is no automatic cleanup for the discovery service registry. You can remove all entries using either the following command (assuming the CLUSTER_NAME is my_wsrep_cluster):
$ curl http://192.168.55.111:2379/v2/keys/galera/my_wsrep_cluster?recursive=true -XDELETE # or
$ etcdctl rm /galera/my_wsrep_cluster --recursive
Conclusion
This combination of technologies opens a door for a more reliable database setup in the Docker ecosystem. Working with service discovery to store state makes it possible to have stateful containers to achieve a homogeneous setup.
In the next blog post, we are going to look into how to manage Galera Cluster on Docker.