In the last couple of blogs, we covered how to run a Galera Cluster on Docker, whether on standalone Docker or on multi-host Docker Swarm with overlay network. In this blog post, we’ll look into running Galera Cluster on Kubernetes, an orchestration tool to run containers at scale. Some parts are different, such as how the application should connect to the cluster, how Kubernetes handles failover and how the load balancing works in Kubernetes.
Kubernetes vs Docker Swarm
Our ultimate target is to ensure Galera Cluster runs reliably in a container environment. We previously covered Docker Swarm, and it turned out that running Galera Cluster on it has a number of blockers, which prevent it from being production ready. Our journey now continues with Kubernetes, a production-grade container orchestration tool. Let’s see which level of “production-readiness” it can support when running a stateful service like Galera Cluster.
Before we move further, let us highlight some of key differences between Kubernetes (1.6) and Docker Swarm (17.03) when running Galera Cluster on containers:
- Kubernetes supports two health check probes - liveness and readiness. This is important when running a Galera Cluster on containers, because a live Galera container does not mean it is ready to serve and should be included in the load balancing set (think of a joiner/donor state). Docker Swarm only supports one health check probe similar to Kubernetes’ liveness, a container is either healthy and keeps running or unhealthy and gets rescheduled. Read here for details.
- Kubernetes has a UI dashboard accessible via “kubectl proxy”.
- Docker Swarm only supports round-robin load balancing (ingress), while Kubernetes uses least connection.
- Docker Swarm supports routing mesh to publish a service to the external network, while Kubernetes supports something similar called NodePort, as well as external load balancers (GCE GLB/AWS ELB) and external DNS names (as for v1.7)
Installing Kubernetes using kubeadm
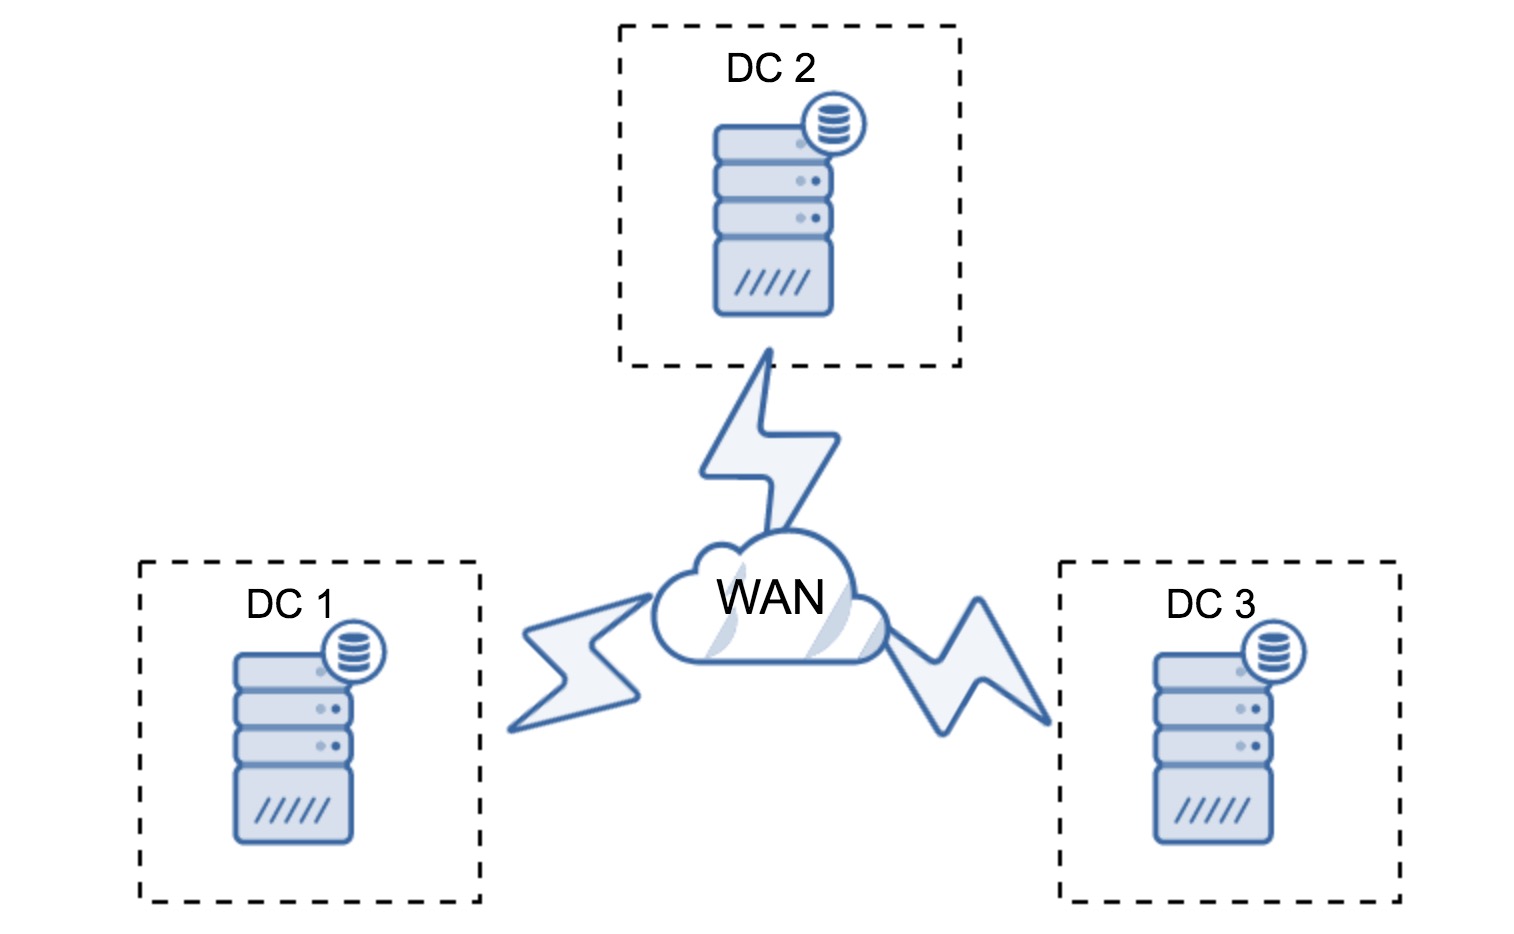
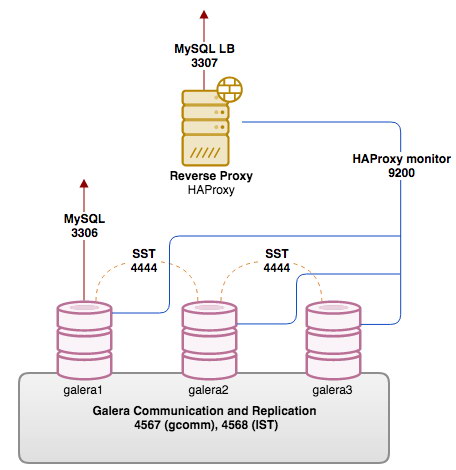
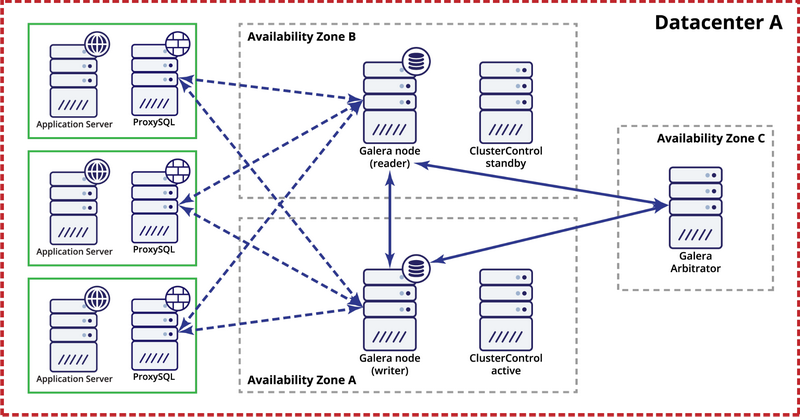
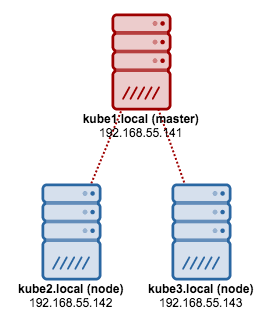
We are going to use kubeadm to install a 3-node Kubernetes cluster on CentOS 7. It consists of 1 master and 2 nodes (minions). Our physical architecture looks like this:
1. Install kubelet and Docker on all nodes:
$ ARCH=x86_64
cat <<EOF > /etc/yum.repos.d/kubernetes.repo
[kubernetes]
name=Kubernetes
baseurl=https://packages.cloud.google.com/yum/repos/kubernetes-el7-${ARCH}
enabled=1
gpgcheck=1
repo_gpgcheck=1
gpgkey=https://packages.cloud.google.com/yum/doc/yum-key.gpg
        https://packages.cloud.google.com/yum/doc/rpm-package-key.gpg
EOF
$ setenforce 0
$ yum install -y docker kubelet kubeadm kubectl kubernetes-cni
$ systemctl enable docker && systemctl start docker
$ systemctl enable kubelet && systemctl start kubelet
2. On the master, initialize the master, copy the configuration file, setup the Pod network using Weave and install Kubernetes Dashboard:
$ kubeadm init
$ cp /etc/kubernetes/admin.conf $HOME/
$ export KUBECONFIG=$HOME/admin.conf
$ kubectl apply -f https://git.io/weave-kube-1.6
$ kubectl create -f https://git.io/kube-dashboard
3. Then on the other remaining nodes:
$ kubeadm join --token 091d2a.e4862a6224454fd6 192.168.55.140:64434. Verify the nodes are ready:
$ kubectl get nodes
NAME          STATUS    AGE       VERSION
kube1.local   Ready     1h        v1.6.3
kube2.local   Ready     1h        v1.6.3
kube3.local   Ready     1h        v1.6.3
We now have a Kubernetes cluster for Galera Cluster deployment.
Galera Cluster on Kubernetes
In this example, we are going to deploy a MariaDB Galera Cluster 10.1 using Docker image pulled from our DockerHub repository. The YAML definition files used in this deployment can be found under example-kubernetes directory in the Github repository.
Kubernetes supports a number of deployment controllers. To deploy a Galera Cluster, one can use:
- ReplicaSet
- StatefulSet
Each of them has their own pro and cons. We are going to look into each one of them and see what’s the difference.
Prerequisites
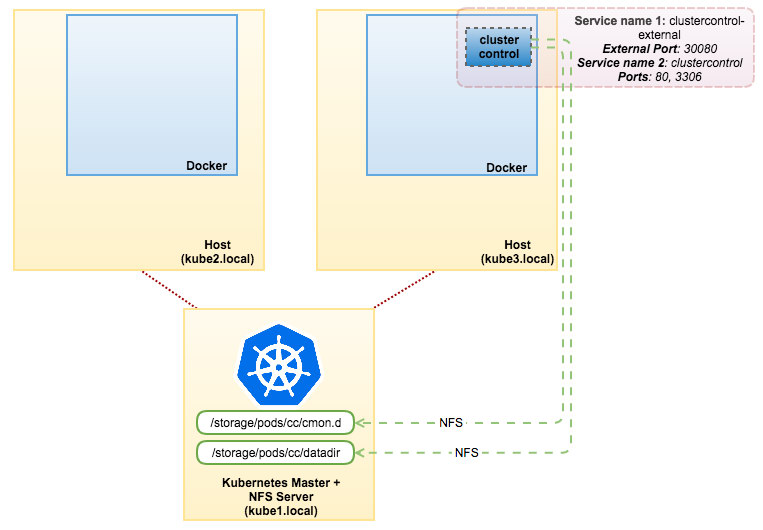
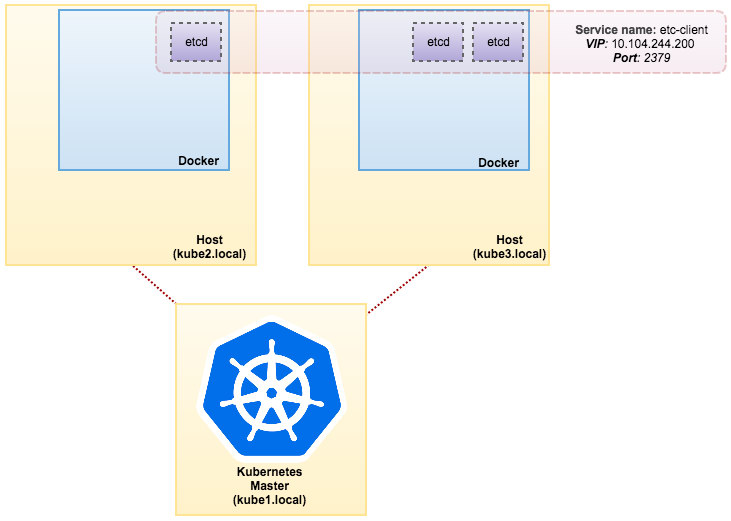
The image that we built requires an etcd (standalone or cluster) for service discovery. To run an etcd cluster requires each etcd instance to be running with different commands so we are going to use Pods controller instead of Deployment and create a service called “etcd-client” as endpoint to etcd Pods. The etcd-cluster.yaml definition file tells it all.
To deploy a 3-pod etcd cluster, simply run:
$ kubectl create -f etcd-cluster.yamlVerify if the etcd cluster is ready:
$ kubectl get po,svc
NAME READY STATUS RESTARTS AGE
po/etcd0 1/1 Running 0 1d
po/etcd1 1/1 Running 0 1d
po/etcd2 1/1 Running 0 1d
NAME CLUSTER-IP EXTERNAL-IP PORT(S) AGE
svc/etcd-client 10.104.244.200 <none> 2379/TCP 1d
svc/etcd0 10.100.24.171 <none> 2379/TCP,2380/TCP 1d
svc/etcd1 10.108.207.7 <none> 2379/TCP,2380/TCP 1d
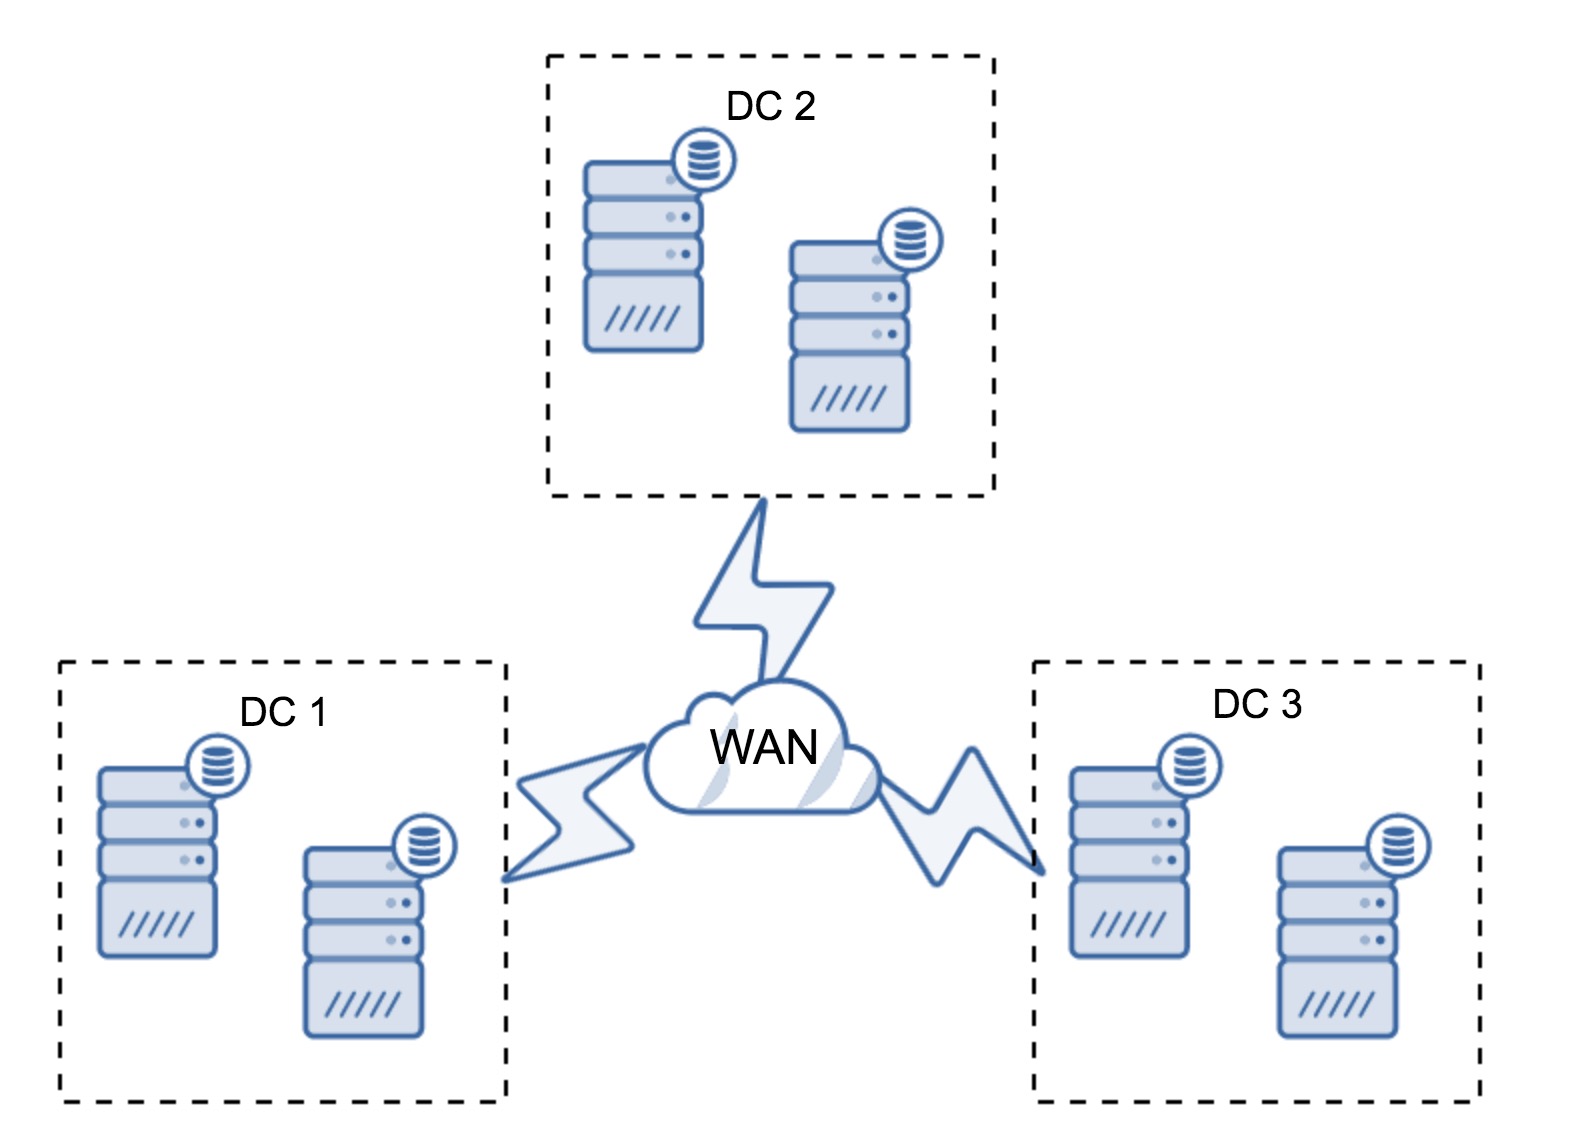
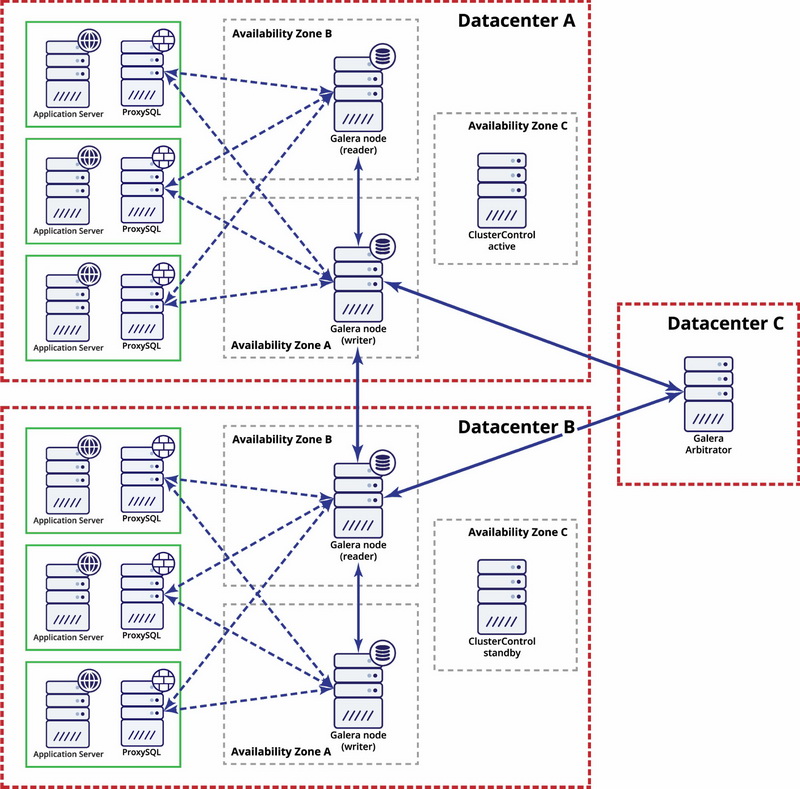
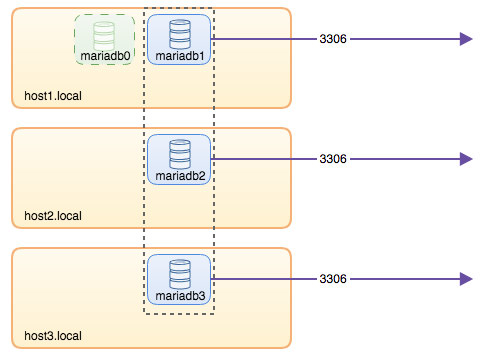
svc/etcd2 10.101.9.115 <none> 2379/TCP,2380/TCP 1dOur architecture is now looking something like this:
Using ReplicaSet
A ReplicaSet ensures that a specified number of pod “replicas” are running at any given time. However, a Deployment is a higher-level concept that manages ReplicaSets and provides declarative updates to pods along with a lot of other useful features. Therefore, it’s recommended to use Deployments instead of directly using ReplicaSets, unless you require custom update orchestration or don’t require updates at all. When you use Deployments, you don’t have to worry about managing the ReplicaSets that they create. Deployments own and manage their ReplicaSets.
In our case, we are going to use Deployment as the workload controller, as shown in this YAML definition. We can directly create the Galera Cluster ReplicaSet and Service by running the following command:
$ kubectl create -f mariadb-rs.ymlVerify if the cluster is ready by looking at the ReplicaSet (rs), pods (po) and services (svc):
$ kubectl get rs,po,svc
NAME DESIRED CURRENT READY AGE
rs/galera-251551564 3 3 3 5h
NAME READY STATUS RESTARTS AGE
po/etcd0 1/1 Running 0 1d
po/etcd1 1/1 Running 0 1d
po/etcd2 1/1 Running 0 1d
po/galera-251551564-8c238 1/1 Running 0 5h
po/galera-251551564-swjjl 1/1 Running 1 5h
po/galera-251551564-z4sgx 1/1 Running 1 5h
NAME CLUSTER-IP EXTERNAL-IP PORT(S) AGE
svc/etcd-client 10.104.244.200 <none> 2379/TCP 1d
svc/etcd0 10.100.24.171 <none> 2379/TCP,2380/TCP 1d
svc/etcd1 10.108.207.7 <none> 2379/TCP,2380/TCP 1d
svc/etcd2 10.101.9.115 <none> 2379/TCP,2380/TCP 1d
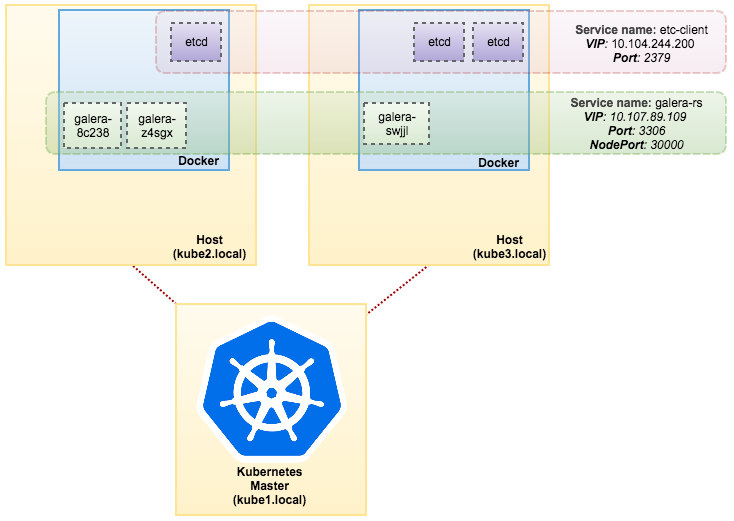
svc/galera-rs 10.107.89.109 <nodes> 3306:30000/TCP 5h
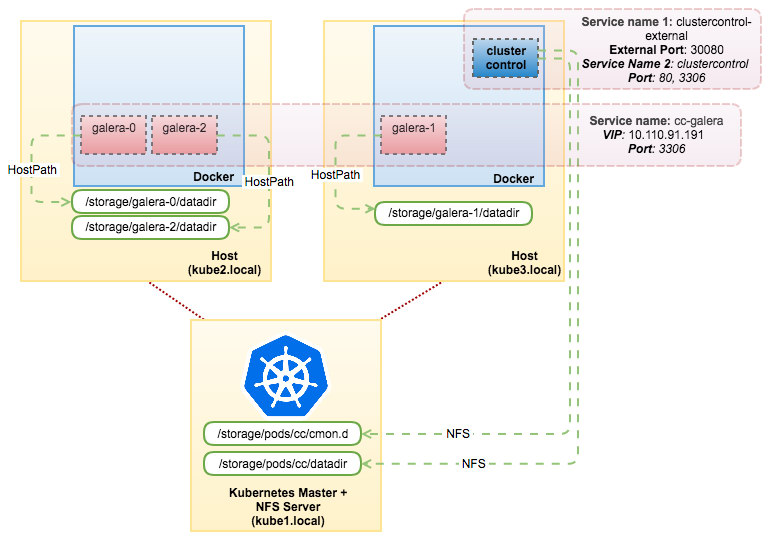
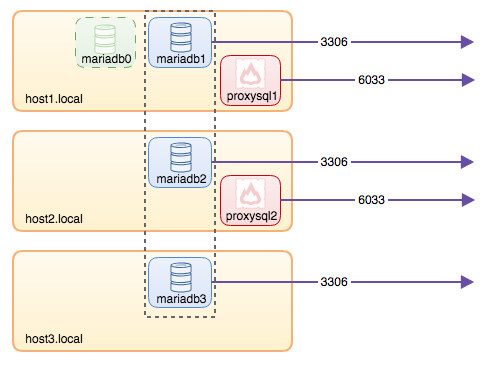
svc/kubernetes 10.96.0.1 <none> 443/TCP 1dFrom the output above, we can illustrate our Pods and Service as below:
Running Galera Cluster on ReplicaSet is similar to treating it as a stateless application. It orchestrates pod creation, deletion and updates and can be targeted for Horizontal Pod Autoscales (HPA), i.e. a ReplicaSet can be auto-scaled if it meets certain thresholds or targets (CPU usage, packets-per-second, request-per-second etc).
If one of the Kubernetes nodes goes down, new Pods will be scheduled on an available node to meet the desired replicas. Volumes associated with the Pod will be deleted, if the Pod is deleted or rescheduled. The Pod hostname will be randomly generated, making it harder to track where the container belongs by simply looking at the hostname.
All this works pretty well in test and staging environments, where you can perform a full container lifecycle like deploy, scale, update and destroy without any dependencies. Scaling up and down is straightforward, by updating the YAML file and posting it to Kubernetes cluster or by using the scale command:
$ kubectl scale replicaset galera-rs --replicas=5Using StatefulSet
Known as PetSet on pre 1.6 version, StatefulSet is the best way to deploy Galera Cluster in production, because:
- Deleting and/or scaling down a StatefulSet will not delete the volumes associated with the StatefulSet. This is done to ensure data safety, which is generally more valuable than an automatic purge of all related StatefulSet resources.
- For a StatefulSet with N replicas, when Pods are being deployed, they are created sequentially, in order from {0 .. N-1}.
- When Pods are being deleted, they are terminated in reverse order, from {N-1 .. 0}.
- Before a scaling operation is applied to a Pod, all of its predecessors must be Running and Ready.
- Before a Pod is terminated, all of its successors must be completely shut down.
StatefulSet provides first-class support for stateful containers. It provides a deployment and scaling guarantee. When a three-node Galera Cluster is created, three Pods will be deployed in the order db-0, db-1, db-2. db-1 will not be deployed before db-0 is “Running and Ready”, and db-2 will not be deployed until db-1 is “Running and Ready”. If db-0 should fail, after db-1 is “Running and Ready”, but before db-2 is launched, db-2 will not be launched until db-0 is successfully relaunched and becomes “Running and Ready”.
We are going to use Kubernetes implementation of persistent storage called PersistentVolume and PersistentVolumeClaim. This to ensure data persistency if the pod got rescheduled to the other node. Even though Galera Cluster provides the exact copy of data on each replica, having the data persistent in every pod is good for troubleshooting and recovery purposes.
To create a persistent storage, first we have to create PersistentVolume for every pod. PVs are volume plugins like Volumes in Docker, but have a lifecycle independent of any individual pod that uses the PV. Since we are going to deploy a 3-node Galera Cluster, we need to create 3 PVs:
apiVersion: v1
kind: PersistentVolume
metadata:
  name: datadir-galera-0
  labels:
    app: galera-ss
    podindex: "0"
spec:
  accessModes:
  - ReadWriteOnce
  capacity:
    storage: 10Gi
  hostPath:
    path: /data/pods/galera-0/datadir
---
apiVersion: v1
kind: PersistentVolume
metadata:
  name: datadir-galera-1
  labels:
    app: galera-ss
    podindex: "1"
spec:
  accessModes:
  - ReadWriteOnce
  capacity:
    storage: 10Gi
  hostPath:
    path: /data/pods/galera-1/datadir
---
apiVersion: v1
kind: PersistentVolume
metadata:
  name: datadir-galera-2
  labels:
    app: galera-ss
    podindex: "2"
spec:
  accessModes:
  - ReadWriteOnce
  capacity:
    storage: 10Gi
  hostPath:
    path: /data/pods/galera-2/datadir
The above definition shows we are going to create 3 PV, mapped to the Kubernetes nodes’ physical path with 10GB of storage space. We defined ReadWriteOnce, which means the volume can be mounted as read-write by only a single node. Save the above lines into mariadb-pv.yml and post it to Kubernetes:
$ kubectl create -f mariadb-pv.yml
persistentvolume "datadir-galera-0" created
persistentvolume "datadir-galera-1" created
persistentvolume "datadir-galera-2" created
Next, define the PersistentVolumeClaim resources:
kind: PersistentVolumeClaim
apiVersion: v1
metadata:
  name: mysql-datadir-galera-ss-0
spec:
  accessModes:
    - ReadWriteOnce
  resources:
    requests:
      storage: 10Gi
  selector:
    matchLabels:
      app: galera-ss
      podindex: "0"
---
kind: PersistentVolumeClaim
apiVersion: v1
metadata:
  name: mysql-datadir-galera-ss-1
spec:
  accessModes:
    - ReadWriteOnce
  resources:
    requests:
      storage: 10Gi
  selector:
    matchLabels:
      app: galera-ss
      podindex: "1"
---
kind: PersistentVolumeClaim
apiVersion: v1
metadata:
  name: mysql-datadir-galera-ss-2
spec:
  accessModes:
    - ReadWriteOnce
  resources:
    requests:
      storage: 10Gi
  selector:
    matchLabels:
      app: galera-ss
      podindex: "2"
The above definition shows that we would like to claim the PV resources and use the spec.selector.matchLabels to look for our PV (metadata.labels.app: galera-ss) based on the respective pod index (metadata.labels.podindex) assigned by Kubernetes. The metadata.name resource must use the format “{volumeMounts.name}-{pod}-{ordinal index}” defined under the spec.templates.containers so Kubernetes knows which mount point to map the claim into the pod.
Save the above lines into mariadb-pvc.yml and post it to Kubernetes:
$ kubectl create -f mariadb-pvc.yml
persistentvolumeclaim "mysql-datadir-galera-ss-0" created
persistentvolumeclaim "mysql-datadir-galera-ss-1" created
persistentvolumeclaim "mysql-datadir-galera-ss-2" created
Our persistent storage is now ready. We can then start the Galera Cluster deployment by creating a StatefulSet resource together with Headless service resource as shown in mariadb-ss.yml:
$ kubectl create -f mariadb-ss.yml
service "galera-ss" created
statefulset "galera-ss" created
Now, retrieve the summary of our StatefulSet deployment:
$ kubectl get statefulsets,po,pv,pvc -o wide
NAME DESIRED CURRENT AGE
statefulsets/galera-ss 3 3 1d galera severalnines/mariadb:10.1 app=galera-ss
NAME READY STATUS RESTARTS AGE IP NODE
po/etcd0 1/1 Running 0 7d 10.36.0.1 kube3.local
po/etcd1 1/1 Running 0 7d 10.44.0.2 kube2.local
po/etcd2 1/1 Running 0 7d 10.36.0.2 kube3.local
po/galera-ss-0 1/1 Running 0 1d 10.44.0.4 kube2.local
po/galera-ss-1 1/1 Running 1 1d 10.36.0.5 kube3.local
po/galera-ss-2 1/1 Running 0 1d 10.44.0.5 kube2.local
NAME CAPACITY ACCESSMODES RECLAIMPOLICY STATUS CLAIM STORAGECLASS REASON AGE
pv/datadir-galera-0 10Gi RWO Retain Bound default/mysql-datadir-galera-ss-0 4d
pv/datadir-galera-1 10Gi RWO Retain Bound default/mysql-datadir-galera-ss-1 4d
pv/datadir-galera-2 10Gi RWO Retain Bound default/mysql-datadir-galera-ss-2 4d
NAME STATUS VOLUME CAPACITY ACCESSMODES STORAGECLASS AGE
pvc/mysql-datadir-galera-ss-0 Bound datadir-galera-0 10Gi RWO 4d
pvc/mysql-datadir-galera-ss-1 Bound datadir-galera-1 10Gi RWO 4d
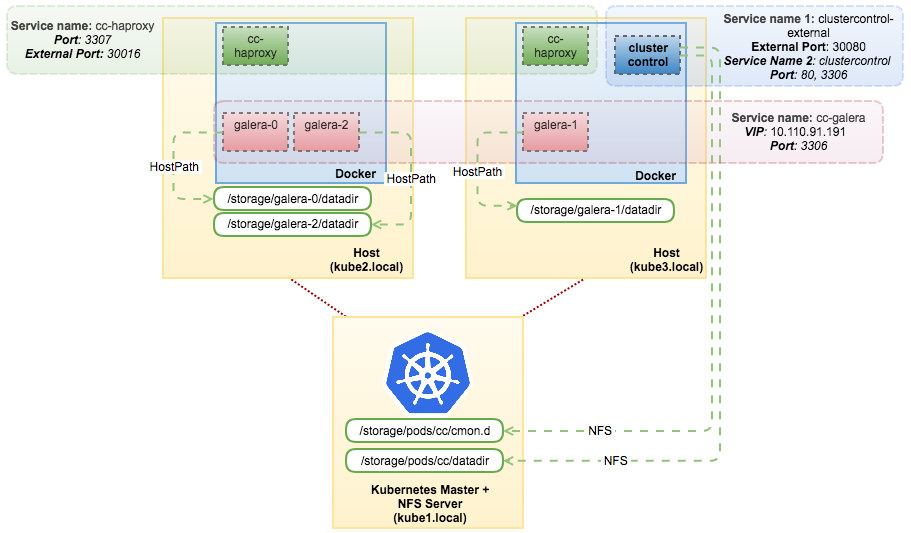
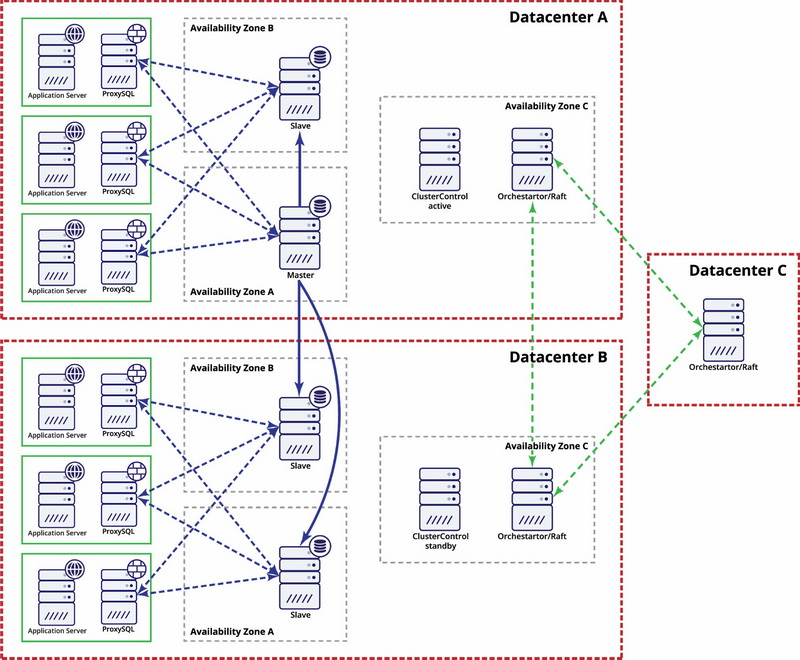
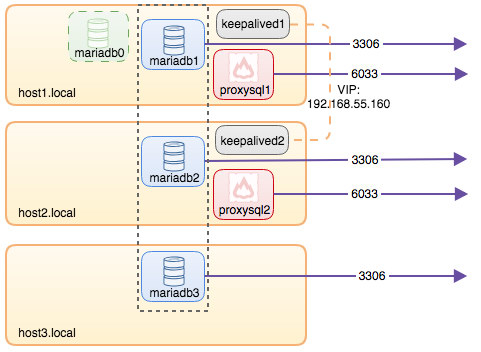
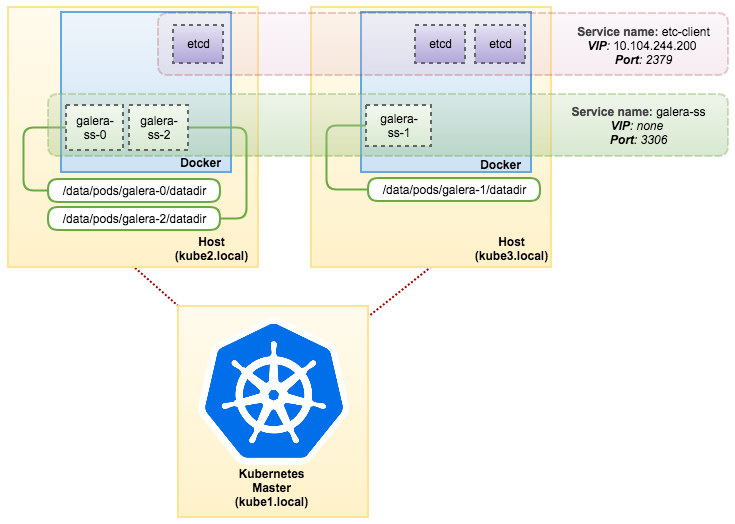
pvc/mysql-datadir-galera-ss-2 Bound datadir-galera-2 10Gi RWO 4dAt this point, our Galera Cluster running on StatefulSet can be illustrated as in the following diagram:
Running on StatefulSet guarantees consistent identifiers like hostname, IP address, network ID, cluster domain, Pod DNS and storage. This allows the Pod to easily distinguish itself from others in a group of Pods. The volume will be retained on the host and will not get deleted if the Pod is deleted or rescheduled onto another node. This allows for data recovery and reduces the risk of total data loss.
On the negative side, the deployment time will be N-1 times (N = replicas) longer because Kubernetes will obey the ordinal sequence when deploying, rescheduling or deleting the resources. It would be a bit of a hassle to prepare the PV and claims before thinking about scaling your cluster. Take note that updating an existing StatefulSet is currently a manual process, where you can only update spec.replicas at the moment.
Connecting to Galera Cluster Service and Pods
There are a couple of ways you can connect to the database cluster. You can connect directly to the port. In the “galera-rs” service example, we use NodePort, exposing the service on each Node’s IP at a static port (the NodePort). A ClusterIP service, to which the NodePort service will route, is automatically created. You’ll be able to contact the NodePort service, from outside the cluster, by requesting {NodeIP}:{NodePort}.
Example to connect to the Galera Cluster externally:
(external)$ mysql -udb_user -ppassword -h192.168.55.141 -P30000
(external)$ mysql -udb_user -ppassword -h192.168.55.142 -P30000
(external)$ mysql -udb_user -ppassword -h192.168.55.143 -P30000
Within the Kubernetes network space, Pods can connect via cluster IP or service name internally which is retrievable by using the following command:
$ kubectl get services -o wide
NAME          CLUSTER-IP       EXTERNAL-IP   PORT(S)             AGE       SELECTOR
etcd-client   10.104.244.200   <none>        2379/TCP            1d        app=etcd
etcd0         10.100.24.171    <none>        2379/TCP,2380/TCP   1d        etcd_node=etcd0
etcd1         10.108.207.7     <none>        2379/TCP,2380/TCP   1d        etcd_node=etcd1
etcd2         10.101.9.115     <none>        2379/TCP,2380/TCP   1d        etcd_node=etcd2
galera-rs     10.107.89.109    <nodes>       3306:30000/TCP      4h        app=galera-rs
galera-ss     None             <none>        3306/TCP            3m        app=galera-ss
kubernetes    10.96.0.1        <none>        443/TCP             1d        <none>
From the service list, we can see that the Galera Cluster ReplicaSet Cluster-IP is 10.107.89.109. Internally, another pod can access the database through this IP address or service name using the exposed port, 3306:
(etcd0 pod)$ mysql -udb_user -ppassword -hgalera-rs -P3306 -e 'select @@hostname'
+------------------------+
| @@hostname             |
+------------------------+
| galera-251551564-z4sgx |
+------------------------+
You can also connect to the external NodePort from inside any pod on port 30000:
(etcd0 pod)$ mysql -udb_user -ppassword -h192.168.55.143 -P30000 -e 'select @@hostname'
+------------------------+
| @@hostname             |
+------------------------+
| galera-251551564-z4sgx |
+------------------------+
Connection to the backend Pods will be load balanced accordingly based on least connection algorithm.
Summary
At this point, running Galera Cluster on Kubernetes in production seems much more promising as compared to Docker Swarm. As discussed in the last blog post, the concerns raised are tackled differently with the way Kubernetes orchestrates containers in StatefulSet, (although it’s still a beta feature in v1.6). We do hope that the suggested approach is going to help run Galera Cluster on containers at scale in production.